In today’s data-driven world, where information overload is a constant challenge, data visualization emerges as a powerful tool to unlock the true potential of data. By transforming complex data sets into intuitive visual representations, data visualization enables us to grasp insights, uncover patterns, and make informed decisions. In this blog post, we’ll explore the importance of data visualization in real-world scenarios and showcase compelling examples of how it has revolutionized various fields.
1. Enhancing Decision-Making: Visualizing data simplifies the decision-making process by providing a clear overview of relevant information. In healthcare, for example, visualizing patient records, medical imaging data, or epidemiological data enables medical professionals to make accurate diagnoses, monitor trends, and identify potential outbreaks, ultimately leading to improved patient care and public health initiatives.
2. Unveiling Trends and Patterns: Data visualization allows us to identify trends and patterns that might otherwise remain hidden in raw data. For instance, in the financial industry, visualizing stock market data through charts and graphs helps investors identify market trends, patterns, and correlations, aiding in the formulation of effective investment strategies.
3. Storytelling and Engaging Stakeholders: Data visualization serves as a powerful storytelling tool, enabling the effective communication of insights to stakeholders. By creating interactive and visually appealing dashboards, reports, or infographics, complex data can be transformed into compelling narratives that engage and inform audiences. This is particularly crucial in fields such as marketing, where visualizing customer behavior, demographics, and market trends helps drive targeted campaigns and understand customer preferences.
4. Identifying Anomalies and Outliers: Visual representations of data facilitate the identification of anomalies and outliers, which may hold critical information or indicate errors in data collection. In cybersecurity, for instance, visualizing network traffic patterns helps detect abnormal behavior, potential breaches, or malicious activities, allowing timely responses to mitigate risks.
5. Exploring Geographic and Spatial Data: Data visualization plays a pivotal role in exploring and analyzing geographic and spatial data. By mapping data onto interactive maps, we can gain insights into demographics, resource distribution, urban planning, and environmental changes. In the transportation industry, visualizing traffic patterns, public transportation routes, and congestion data aids in optimizing routes, improving efficiency, and reducing carbon footprints.
Conclusion:
Data visualization has become an indispensable tool in various real-world scenarios, revolutionizing the way we analyze, understand, and communicate complex information. By leveraging visual representations, we can uncover hidden insights, drive informed decision-making, and effectively engage stakeholders. Whether in finance, healthcare, marketing, cybersecurity, or urban planning, the power of data visualization continues to transform industries, propelling us towards a data-driven future where actionable insights are readily accessible to all
Remember, data visualization is not just about creating pretty pictures; it’s about unraveling the stories and actionable insights hidden within data, empowering us to make better-informed choices and drive positive change.
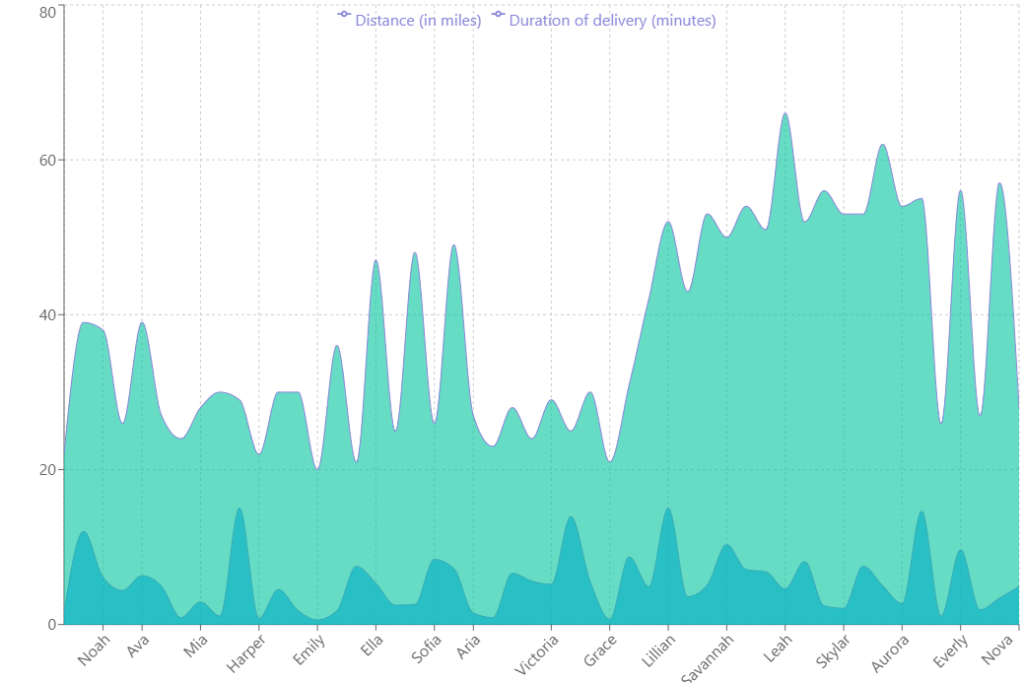
We developed a small demo app in visualizing data where you can upload spreadsheet and use different charts to visualize it and download the visualization.
See https://data-viz-demo.incrementtum.com/